Which ad drives sales? A Meta ads report by creative
The report in CAPI Platform (capip.uz) puts Meta ad spend and CRM outcomes — from Bitrix24, amoCRM (Kommo) or capiCRM — in one table. For every creative, ad, ad set and campaign it shows what was spent, how many leads came, how many were qualified, how many became sales and what one customer cost. Ads Manager shows the price of a lead; this report shows which ad drives sales.
- Spend, leads, CPL, qualified leads, CPQL, sales, CAC, revenue and ROAS in one table
- By creative, ad, ad set and campaign
- Counts people, not rows
- Works with Bitrix24, amoCRM (Kommo) and capiCRM
The lead price is great. Where are the sales?
The report in Ads Manager stops at the lead. The sale happens in the CRM — after a call, a meeting and a payment.
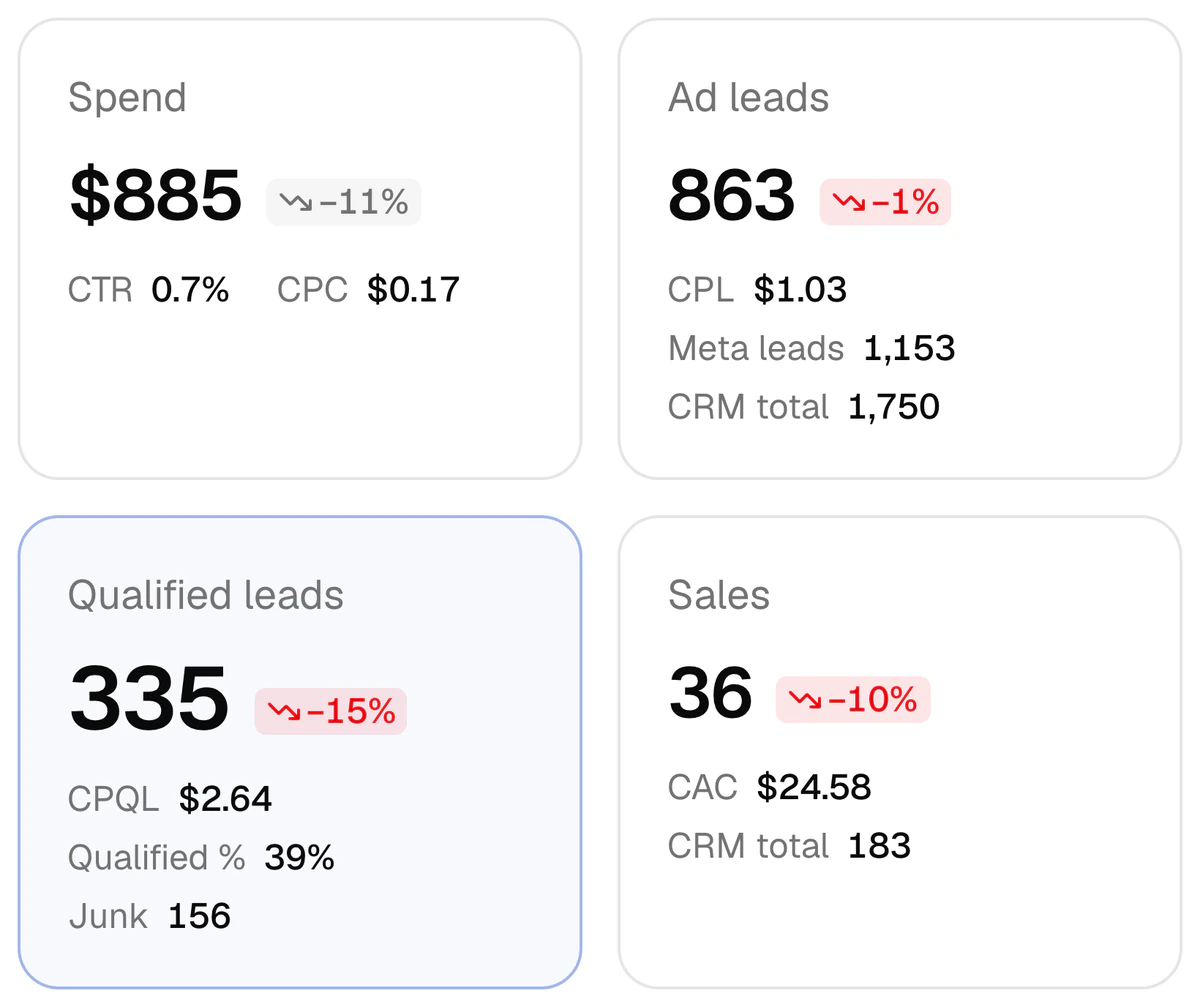
The chat is an illustration; the numbers are from a real report (a driving school, 2–8 October 2026). Both are right about their own number: one is looking at the ad account, the other at the CRM. The report puts both numbers on one row.
- 863 leads this week. Sales: 36.
- Cost per lead is $1.03. That is a great result.
- This ad here: 79 leads, 0 sales.
- In Ads Manager it is the “best” ad.
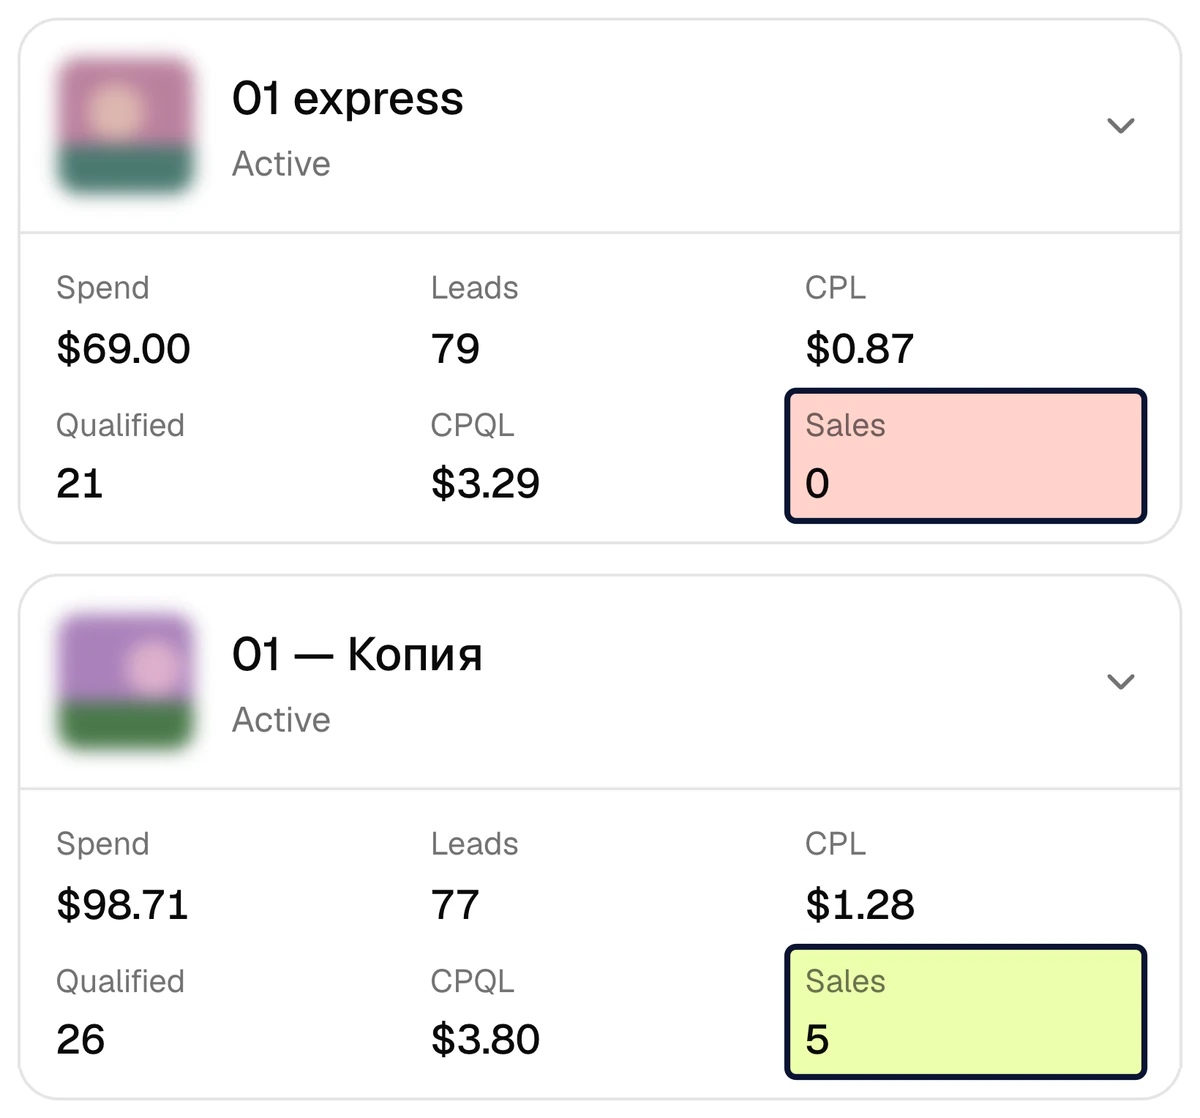
79 leads, 0 sales. 77 leads, 5 sales
The first creative brings leads at $0.87 each: in Ads Manager it is the “best” ad. In the CRM it has not produced a single sale. The second creative’s lead costs $1.28 — 47% more — and the outcome is different: 77 leads, 26 qualified, 5 sales. Both ran in the same project in the same week; only the CRM outcome tells them apart.
- Sort by cost per lead and the first creative wins.
- Sort by sales and the second one does.
- Click a column header to sort the table by any metric.
$386 went to 23 creatives with no sale
Driving school, 2–8 October 2026. The week’s spend was $885; 44% of it went to creatives that did not bring a single sale.
- spent on creatives with no sale44% of the budget
- $386
- creatives spent money and sold nothing
- 23
- sales in the weekcost per customer (CAC): $24.58
- 36
- ROASrevenue recorded in the CRM: $5,297
- 5.99×
This is one week of one project, not a promise of results. Not every creative without a sale is a bad one: a new creative’s leads may not have reached payment yet. That is why the report has two counting methods, described below.
What the report shows
A spend-to-sale report is a table that ties ad spend to CRM outcomes: spend → lead → qualified lead → sale, separately for every creative. The right-hand column is one week of a driving school.
| Metric | How it is calculated | Driving school, 2–8 October 2026 |
|---|---|---|
| Spend | Read from Meta, refreshed every hour | $885 |
| Leads | People who reached the CRM and are tied to a specific ad | 863 |
| CPL, cost per lead | spend ÷ leads | $1.03 |
| Qualified leads | Reached the CRM stage marked as a qualified lead | 335 (39%) |
| CPQL, cost per qualified lead | spend ÷ qualified leads | $2.64 |
| Sales | Moved to a sale stage in the CRM | 36 |
| CAC, customer acquisition cost | spend ÷ sales | $24.58 |
| Revenue | Deal amounts recorded in the CRM, in the report currency | $5,297 |
| ROAS | revenue ÷ spend | 5.99× |
More columns: impressions, clicks, CTR, CPC, CPM, qualified % and junk leads. Cost metrics are calculated only on leads tied to an ad: a walk-in customer, or a call that no ad can be tied to, is not counted against ad spend.
Lead → qualified lead → sale: where the money stays
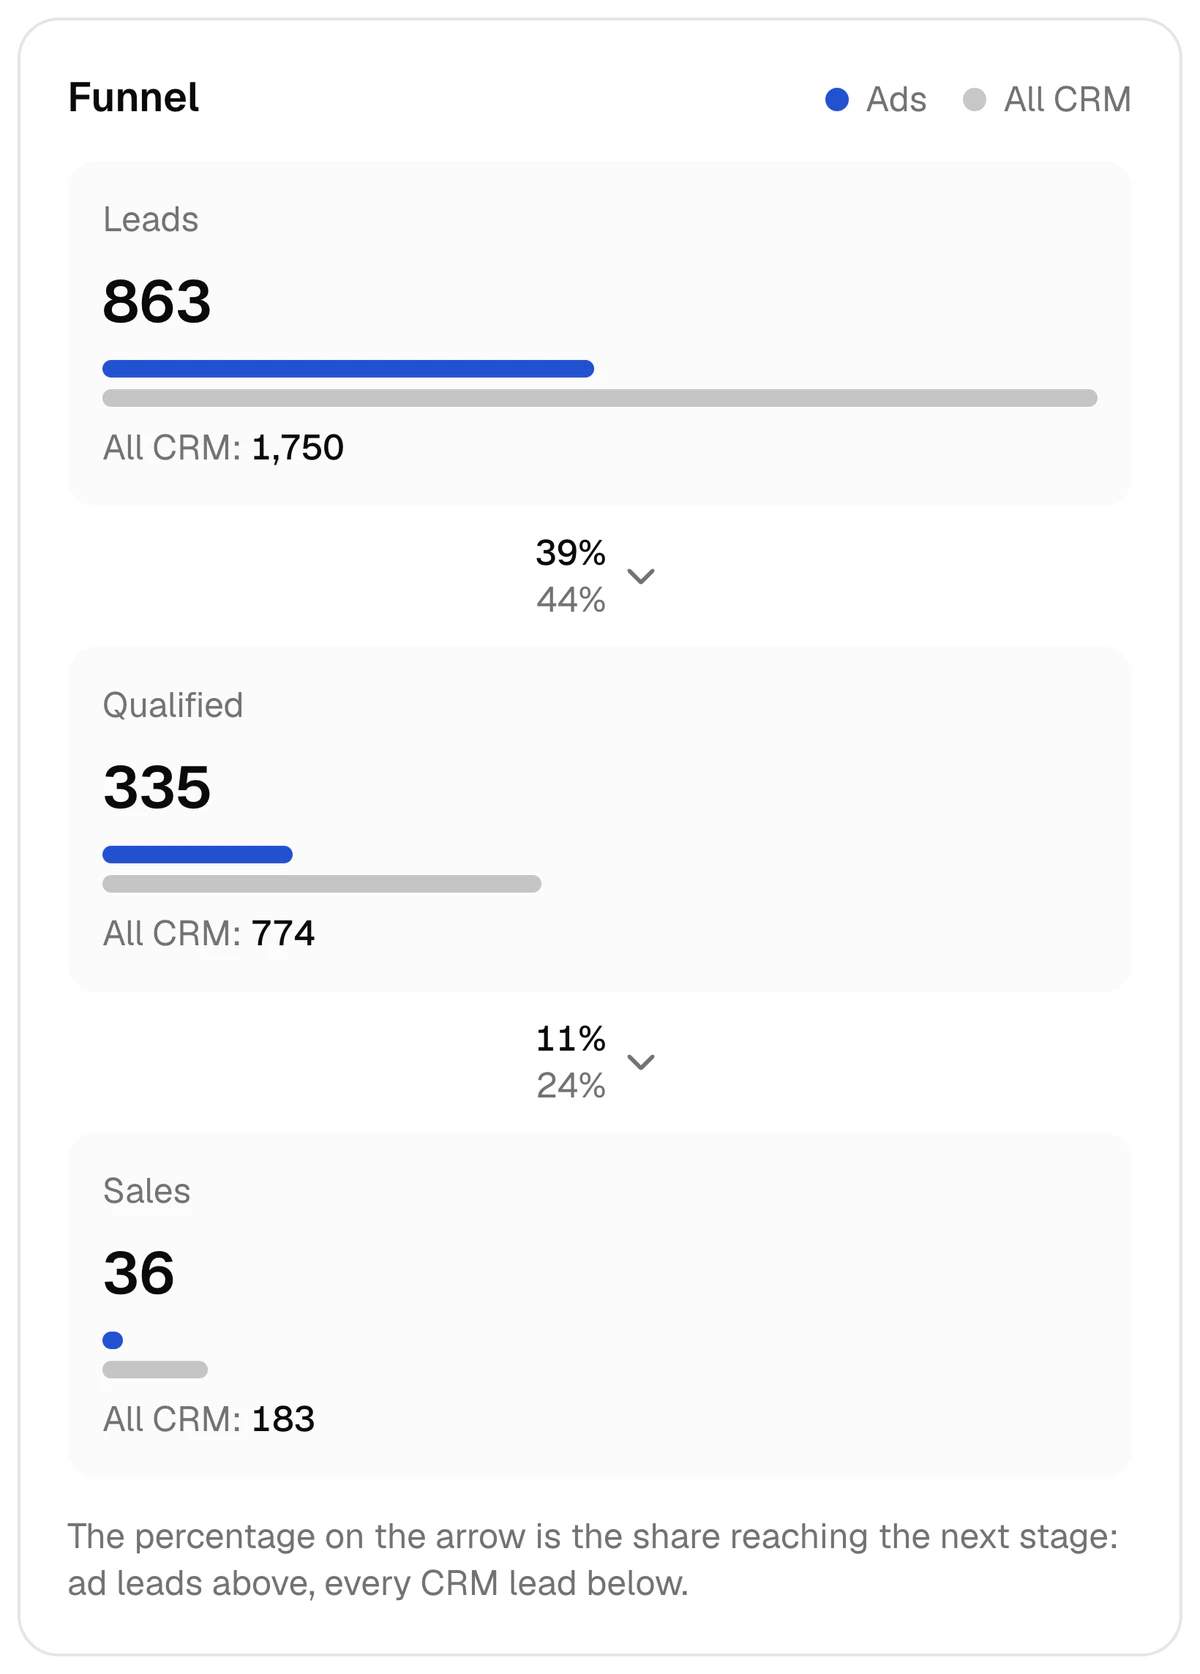
The funnel block splits the period into three steps. The driving school’s week: 863 leads, 335 qualified (39%), 36 sales. The percentage on each arrow is the share that reached the next stage. The top row is ad leads; the bottom row is every lead in the CRM.
- A low qualified share is a question for the ads: who are they bringing in?
- Plenty of qualified leads and few sales is a question for the sales team.
- Which stage counts as a qualified lead and which as a sale is set once, from your own CRM pipeline.
- On its own, Meta saw 863 leads that week and none of the 36 sales. The Conversions API fixes that.
How can you slice the report?
Creative, ad, ad set, campaign
One control switches the grouping. In the “Creative name” view, ads with the same name are merged — the most accurate picture when one creative runs in several ad sets.
Periods and comparison
Today, yesterday, 7 days, 30 days, this or last week and month, or any custom range. Compare with the previous period, the same days last month or another period: every cell shows the change.
People, not rows
Someone fills in a form and later phones in: two records in the CRM, one person in the report. Repeat leads are merged by phone, and the sale goes to the ad that brought the person first. A Bitrix24 Lead → Deal is one lead too.
Unattributed leads stay visible
Leads that could not be tied to an ad are shown separately by channel, each with the reason and the fix. The share of leads tied to a specific ad is stated as well.
The “Worth a look” block
The report points things out itself: creatives that spent 5% or more of the budget without a single qualified lead, the cheapest qualified leads, and how CPQL moved against the previous period.
Pause from the table
Preview the creative in place, and pause or re-enable an ad, ad set or campaign straight from the table. Only owners and admins can do this, and the Meta token needs the
ads_managementpermission.
Which week does a sale belong to? Two counting methods
A lead arrives today; the payment may come three weeks later. So “how many sales did we have this week?” has two correct answers. The report has both, one switch apart.
| Events in the period | Cohort (by lead creation date) | |
|---|---|---|
| What it counts | Leads that arrived, leads that became qualified and payments made on these days — whenever the lead itself arrived | Leads created in the period and their outcome as of today: qualified or not, sold or not |
| The question it answers | What happened this week? | What became of this week’s leads? |
| When to use it | Weekly results: this is the method that matches the CRM’s own weekly numbers | Judging a creative, once its leads have had time to reach payment |
What you decide with this report every week
Once a week, in this order. The aim is to split the budget by sales, not by cost per lead.
- 1
Open last week and group by creative name
Turn on comparison with the previous period: every cell shows the earlier week’s figure and the change.
- 2
Pause what brings no qualified leads
The “Worth a look” block lists the creatives that spent 5% or more of the budget without a single qualified lead. At a learning centre (2–8 October 2026) a qualified lead cost $2.20 in one creative and $71.40 in another — 32 times more.
- 3
Sort by sales and move budget to what sells
Look at the Sales and CAC columns. At the driving school the creative with a 47% dearer lead made 5 sales; the creative with the $0.87 lead made none.
- 4
Check how CPQL moved
If CPQL is up on the previous week, switch the grouping to campaigns: the table shows which one is behind it.
- 5
Check that the data is complete
What share of leads is tied to an ad, and how many sales carry no amount? If either looks weak, fix the tracking first: the UTM template on your ads, the Page that owns your lead forms, the amounts managers enter.
- 6
Send the summary to the team
A short version of this report goes to Telegram by itself every day, week or month, with the best creatives and the spend that brought no qualified leads.
The report opens on a phone too
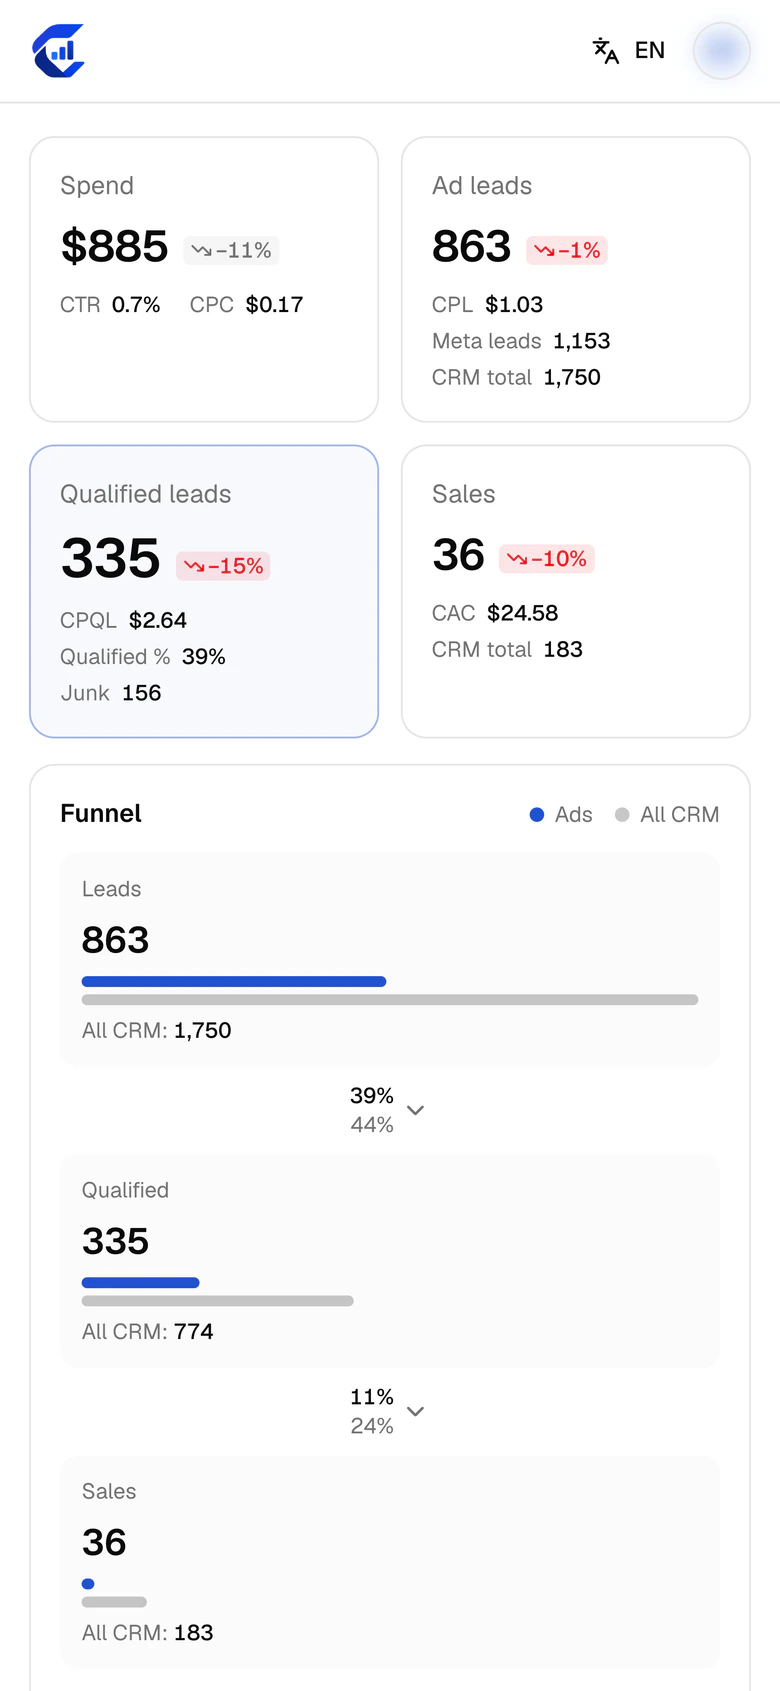
The report runs in a browser, on a computer or a phone; there is no separate app to install. On a phone the table turns into cards: tap a creative and its numbers open.
- An owner sees spend, leads, qualified leads and sales away from the desk.
- A media buyer shows the client the live report instead of a screenshot.
- The interface is in Uzbek, Russian and English.
Where else these numbers work
Conversions API
Qualified leads and sales from the report go back to Meta as signals: QualifiedLead and Purchase.
Telegram reports
A daily, weekly or monthly summary in a group or a private chat.
Which creative sells
Judging a creative by sales rather than by leads: the full article.
CPL, CPQL, CAC, ROAS
Four metrics on one funnel, with formulas and a worked example.
Cases
A driving school and a learning centre: the 7-day and 30-day numbers.
Pricing
Set-up is $159 once, then $40 a month.
Questions about the report
How is this report different from Ads Manager?
Ads Manager shows what happened inside the ad platform: impressions, clicks, leads and cost per lead. Whether a lead was qualified and whether it bought is in the CRM. The CAPI Platform report puts the two on one row: next to every creative stand its qualified leads, sales, CAC and ROAS.
Which CRMs and ad platforms does the report work with?
CRMs: Bitrix24, amoCRM (Kommo) or capiCRM, the CRM inside CAPI Platform; one CRM per project. The only ad platform is Meta (Facebook and Instagram). More: integrations.
When does the report start to fill?
On the day the CRM is connected, the last 30 days of its history load into the report, so there is something to compare with from day one. Old leads are not sent to Meta; they are there for the report only.
What about leads from Instagram Direct, WhatsApp or phone calls?
They are in the report, but by channel, under “Leads not attributed to an ad”, each with the reason. The platform does not tie them to an ad automatically. The exception: if the same person filled in a Meta lead form before, the phone number puts them on that ad. Leads from Meta lead forms are tied to their ad with certainty; website leads are tied through the UTM tag (the ad ID) in the ad’s link.
Will the report match the numbers in my CRM?
The “Events in the period” method matches the CRM’s weekly numbers. One difference is possible: the report counts people, not rows, so repeat leads of one person are merged by phone.
What happens to ROAS if managers do not enter deal amounts?
Revenue is what was recorded in the CRM, so missing amounts understate revenue and ROAS. The report shows how many sales carry no amount. If you set a default sale amount in Settings, sales without an amount are counted at it.
The CRM is in so‘m and the ads are in dollars. How is revenue calculated?
The report currency and the CRM currency are set separately in Settings. The rate comes from the Central Bank of Uzbekistan automatically — each sale at the rate of its own day — or you enter it by hand. Revenue is converted into the report currency, so it stands in the same currency as spend.
What does it cost?
Set-up is $159 once: in 3 days the CRM is connected, stages are tied to signals and a test signal is sent. Then $40 a month: the Conversions API signals, this report, Telegram reports and lead integration up to 4,000 leads a month. More: pricing.
See which of your ads sells, on your own numbers
Sign up with Google and connect Meta and your CRM yourself, or leave a request and we will set it up in 3 days. Set-up is $159 once, then $40 a month.