Which ad creative actually drives sales? Reading a Meta ads report by sales, not cost per lead
Sardor Rakhmonkulov7 min read
Ads Manager alone cannot show which ad creative drives sales: it counts leads, and sales are recorded in the CRM. Put the CRM outcome (qualified leads and sales) next to each creative. In one driving school’s week, a creative with $0.87 leads brought 79 leads and 0 sales; one with $1.28 leads brought 77 leads and 5 sales. By cost per lead, the selling one would have been paused.
In short
- Ads Manager counts leads; the sale stays in the CRM: in the driving school’s week Meta on its own saw 863 leads and none of the 36 sales.
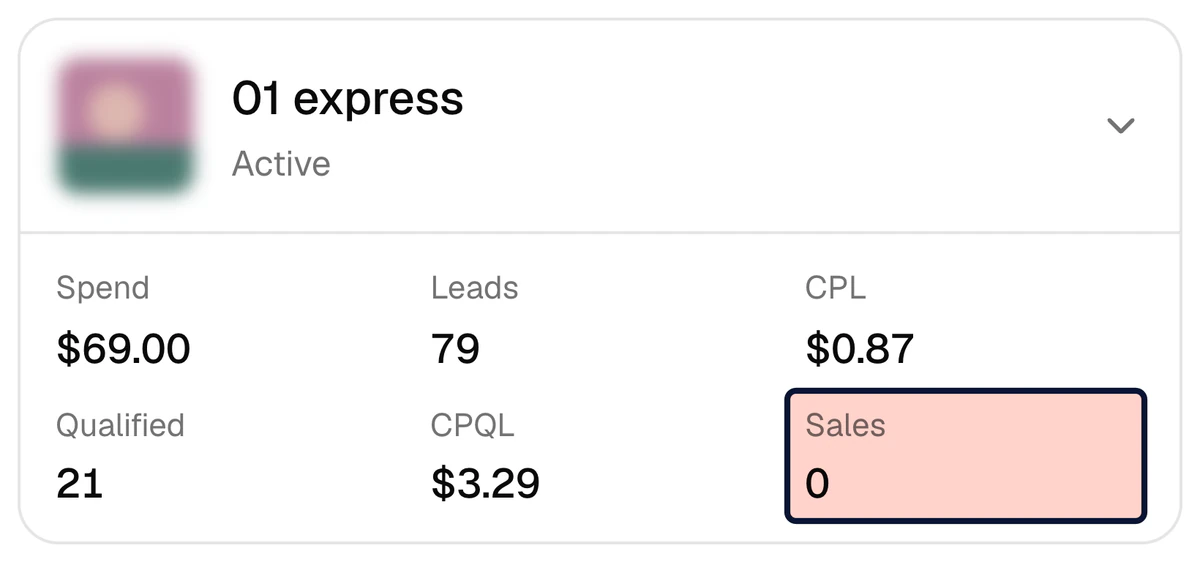
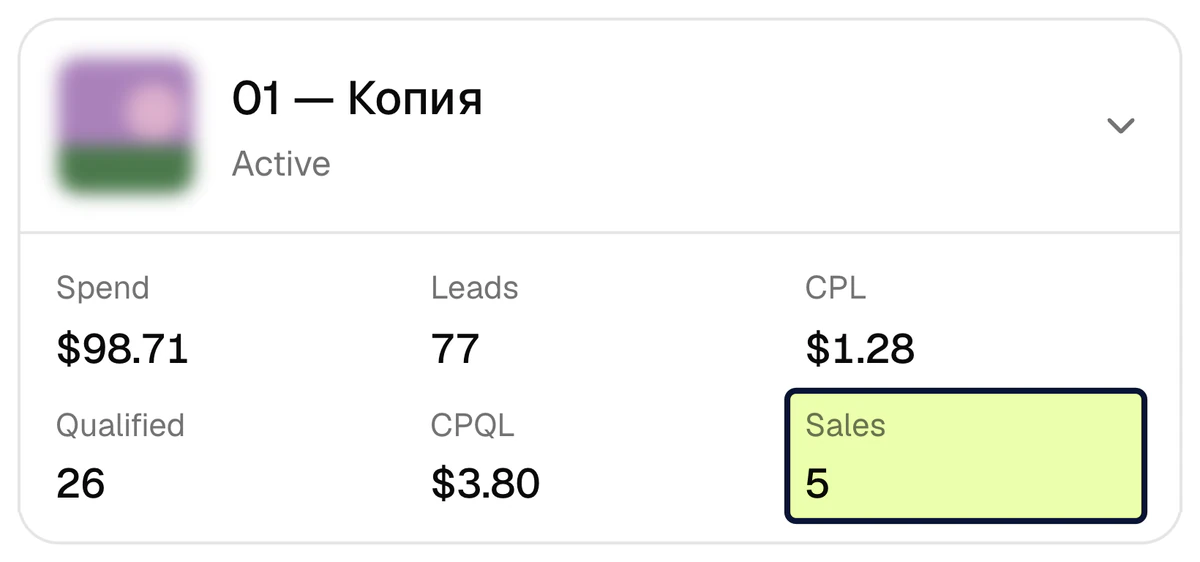
- One creative: 79 leads at $0.87, 0 sales. Another: 77 leads at $1.28, 5 sales. The first wins on CPL and CPQL; the second wins on sales.
- In the same week $386 — 44% of the budget — went to 23 creatives without a single sale.
- A rule of thumb: once a creative has collected three times the leads one sale takes and sold nothing, move its budget (past 72 leads in the driving school’s case).
- Sales lag behind leads: judge a new creative on qualified leads first, and check sales in a cohort view once the sales cycle has passed.
“Which ad creative actually drives sales?” Ads Manager answers with cost per lead, and a lead is not yet a sale. Below, how to analyse Meta (Facebook and Instagram) creatives by sales: what to read in the table, what to pause, what to scale and how long to wait. The numbers come from a real report.
Why can’t Ads Manager show which ad sells?
In a lead-form campaign the last thing Meta sees is a submitted form. The call, the meeting and the payment happen later, in the CRM. In the driving school example (2–8 October 2026) Meta counted 863 leads in a week; that week’s 36 sales were closed in the CRM, and Meta learns of a sale only if the CRM tells it.
So sorting in Ads Manager answers one question: which ad collects forms most cheaply. Which one sells shows only when the CRM outcome sits next to it.
Creative analysis by sales compares ad creatives by what their leads became in the CRM (qualified leads and sales) rather than by cost per lead. It needs ad spend and CRM outcomes in one table, one row per creative.
What happens if you judge a creative by cost per lead? 79 leads, 0 sales
One driving school, one week (2–8 October 2026), two creatives. The first brought leads at $0.87, below the account’s average cost per lead ($1.03). The second, at $1.28: 47% more. Lead volume was nearly equal: 79 and 77.
| Metric | First creative | Second creative | Who wins |
|---|---|---|---|
| Spend | $69.00 | $98.71 | — |
| Leads | 79 | 77 | Nearly equal |
| Cost per lead (CPL) | $0.87 | $1.28 | First |
| Qualified leads | 21 | 26 | Second |
| Cost per qualified lead (CPQL) | $3.29 | $3.80 | First |
| Sales | 0 | 5 | Second |
| Cost per sale | — | $19.74 | Second |
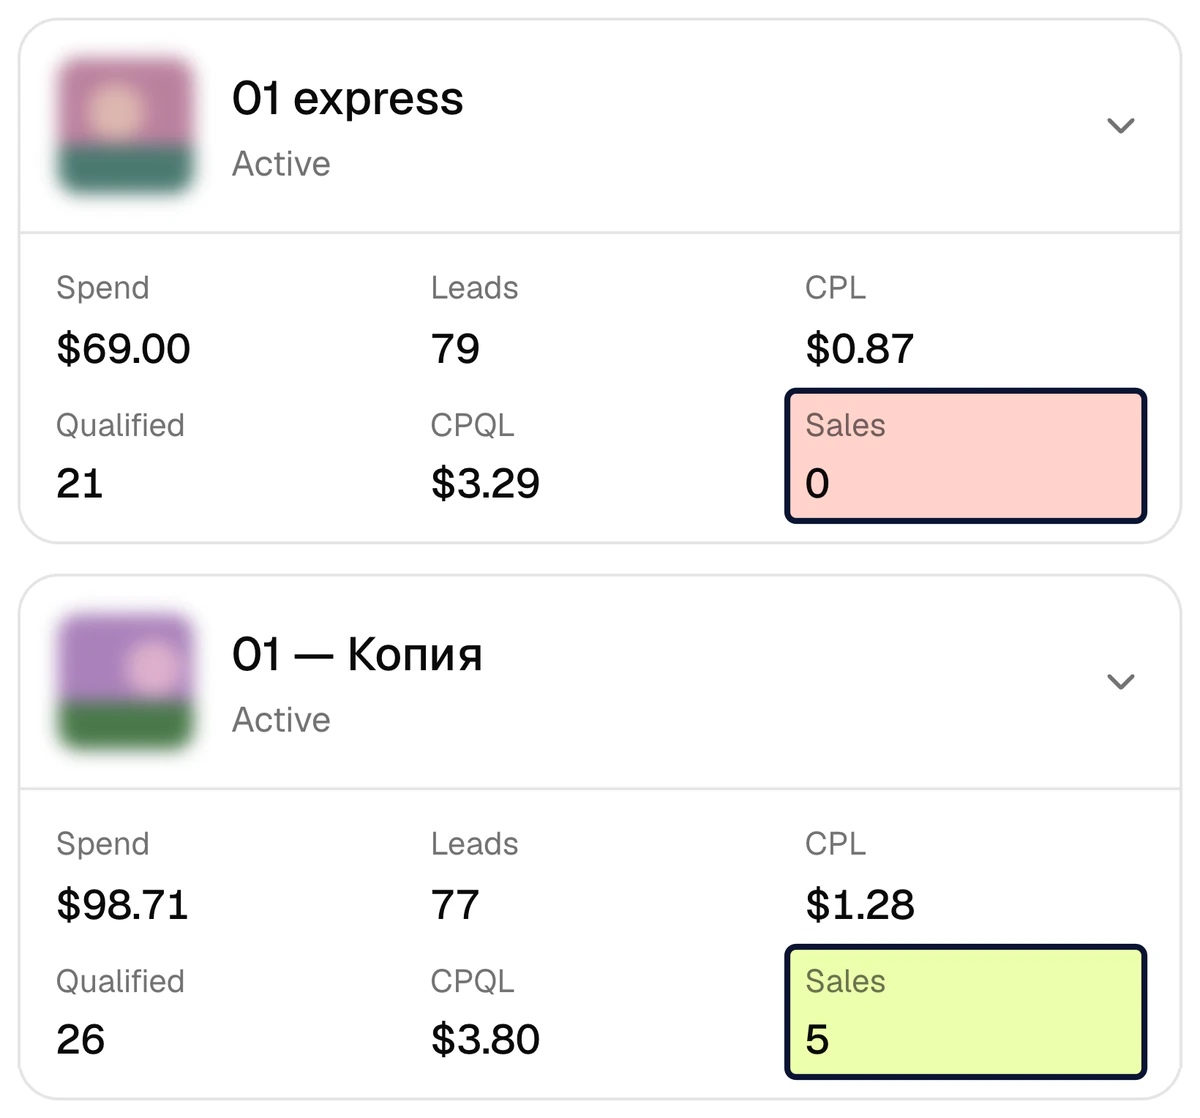
On cost per lead the first creative wins. On cost per qualified lead too: $3.29 against $3.80. Judged by CPL or CPQL, the first would get more budget and the second would be paused as “expensive”. Only the sales row showed the difference: 0 and 5.
A cheap lead is not a bad lead; cost per lead simply says nothing about sales. The reasons are in the article on cheap leads with no sales.
How do you read a per-creative table?
Each creative is one row. Some columns come from the ad account, some from the CRM, and each answers a different question.
| Column | Source | The question it answers | What it cannot tell you |
|---|---|---|---|
| Spend | Meta | How much went to this creative? | What that money brought |
| Leads, cost per lead (CPL) | Meta | How many people submitted the form, at what price? | Whether they are buyers |
| Qualified leads, CPQL | CRM | How many did sales confirm as real buyers? | Whether they will pay |
| Sales, cost per sale | CRM | Who paid, and what did one customer cost? | What next week will look like |
Read the table from the end: sales first, then qualified leads, cost per lead last. The usual habit is the reverse: sort by cost per lead and decide on the spot.
Cost per sale = spend on the creative ÷ sales from that creative
Example: Driving school, 2–8 October 2026, second creative: $98.71 ÷ 5 = $19.74. The account’s customer acquisition cost (CAC) that week was $24.58. More on the formulas: CPL, CPQL, CAC and ROAS.
How much budget goes to creatives with no sales?
The first creative was not alone that week.
- went to creatives with no sale44% of the week’s budget
- $386
- creatives spent money and brought no sale
- 23
- per such creative, on average$386 ÷ 23
- ≈ $17
Read this number with care. Such a creative spent about $17 on average, less than one customer cost that week ($24.58): too early to call each of them bad.
But the sum is large: 44% of the budget brought no sale, and Ads Manager on its own does not show it: it counts leads, not sales. So sort by spend: check the creatives that took the most money first, and let the small ones collect leads.
How long should you wait before judging a creative?
A sale is a rare event, so small numbers mislead. That week one sale took about 24 leads on average (863 ÷ 36). A creative with 10 leads and no sale tells you nothing: at that rate it was due less than half a sale. One with 79 leads was due about 3 (79 ÷ 24). Zero where three were expected is rarely chance.
| Leads on the creative | In the driving school example | What no sales means | What to do |
|---|---|---|---|
| Fewer than N | fewer than 24 | Nothing: too little data | Leave it alone; watch the qualified share |
| N to 3N | 24–72 | A warning | Decide on qualified leads and CPQL |
| More than 3N | more than 72 | Grounds to say the creative does not sell | Move its budget to those that do |
The first creative (79 leads, 0 sales) falls in the third row. The second’s 5 sales are a small number too: next week it could be 3 or 7. So the decision is “move the budget and check again next week”, not “delete”. With few leads, judge on 30 days, not one week.
What should you pause and what should you scale each week?
Once a week, in the same order. By hand that means exports from Ads Manager and the CRM joined in a spreadsheet; the CAPI Platform report has it in one table.
- 1
Open last week and the last 30 days
Group by creative name: ads with the same name merge into one row. The week shows what changed; 30 days give numbers large enough to judge.
- 2
Sort by spend, not by cost per lead
Start where the most money goes: a wrong call costs most there.
- 3
Compare each row with N
Fewer leads than N: leave it alone. N to 3N: look at qualified leads and CPQL. Above 3N with no sale: a candidate to pause.
- 4
Move the budget
Pause what does not sell, add to what does. In CAPI Platform an ad, ad set or campaign is paused and re-enabled from the table itself (owner or admin only; the Meta token needs
ads_management). - 5
Write the decision down and check it next week
One line: what changed, when and why. A week later, check in the cohort view whether the paused creative’s earlier leads turned into sales; if they did, switch it back on.
What does a creative to pause look like?
Two kinds. One has enough leads and no sales, like the card below: 79 leads, 0 sales. The other spends money and brings no qualified lead at all: no need to wait, since a qualified lead is known long before a sale. The CAPI Platform report’s “Worth a look” block lists creatives that spent 5% or more of the budget without a single qualified lead.
What does a creative to scale look like?
It has sales, and its cost per sale is below the account average: $19.74 for the second creative against $24.58. Raise the budget in steps, not all at once, and check again every week: as the budget grows, lead price and quality can both change. An “expensive” lead is no reason to pause a creative.
What has to be in place before you can trust the table?
A per-creative table tells the truth only when three things hold.
- Stages are kept in the CRM. The sales team has agreed which stage means “qualified lead” and which means “sale”, and managers move leads through them on time.
- Each lead is tied to its ad. A lead from a Meta lead form is tied exactly. A website request needs a UTM tag with the ad ID in the ad’s link. Leads from Instagram Direct, WhatsApp, Telegram or phone calls are not tied to an ad automatically: the report shows them by channel.
- People are counted, not rows. One person who submits twice is not two leads. The CAPI Platform report merges repeat leads by phone.
Once you know which creative sells, tell Meta. Qualified leads and sales go back from the CRM as signals through the Conversions API; the article on optimising for qualified leads covers the rest.
Sort your creatives by sales, not by cost per lead
CAPI Platform connects Meta ads with Bitrix24, amoCRM (Kommo) or capiCRM: spend, leads, qualified leads and sales per creative in one table. Set-up is $159 once (3 days), then $40 a month.
FAQ
How many leads do you need before judging a creative?
There is no universal number; it depends on the account. First work out how many leads one sale takes: leads ÷ sales. If a creative has collected three times that many and brought no sale, there are grounds to take its budget away. In the driving school example that is 24 × 3 = 72 leads. It is a rule of thumb, not an exact law.
Should you turn off a creative with no sales right away?
No. Check its lead count first: if it is low, wait and watch the share of qualified leads. If it is high, pause it rather than delete it: its leads may still reach a sale later, and the cohort view will show that. A paused ad can be switched back on at any time.
Isn’t cost per qualified lead enough to judge a creative?
CPQL is the early indicator: a qualified lead is known before a sale, so it is what you look at in the first week. But it is not the last word. In the driving school example a qualified lead cost $3.29 in the first creative and $3.80 in the second, while sales were 0 and 5.
If a lead comes through Instagram Direct or a phone call, is it tied to a creative?
Not automatically. A lead from a Meta lead form is tied to its ad exactly; a website request is tied when the UTM tag in the ad’s link carries the ad ID. Leads from Direct, WhatsApp, Telegram and calls appear in the report by channel, not by creative. So creative analysis is reliable for lead-form ads and for ads that lead to a website.
Can you find out which ad sells without a CRM?
Not reliably: somewhere it has to be recorded which stage each lead reached and who paid. A spreadsheet can do it, but each lead then has to be tied to its ad by hand. CAPI Platform has its own CRM, capiCRM: leads from Meta lead forms land in it by themselves, and every card shows which ad the lead came from. Bitrix24 and amoCRM (Kommo) connect as well.
Sources
- 1Conversion Leads integration — Meta for Developers
Read next
- Lead quality
Cheap Facebook leads but no sales: why low-quality leads happen and how to fix them
Why a cheap lead does not sell: two creatives from a real report, causes on three sides and a seven-step fix.
7 min read
- Metrics
CPL vs CPQL vs CAC vs ROAS: four formulas, one funnel, a worked example
Four metrics, four formulas and one real week: $885 of spend → 863 leads → 335 qualified leads → 36 sales.
7 min read
- Lead quality
How to optimize Meta lead ads for qualified leads, not lead volume
Moving a Meta campaign from lead volume to qualified leads: the stage, the custom conversion, signal volume, the numbers.
8 min read